Project Monitoring
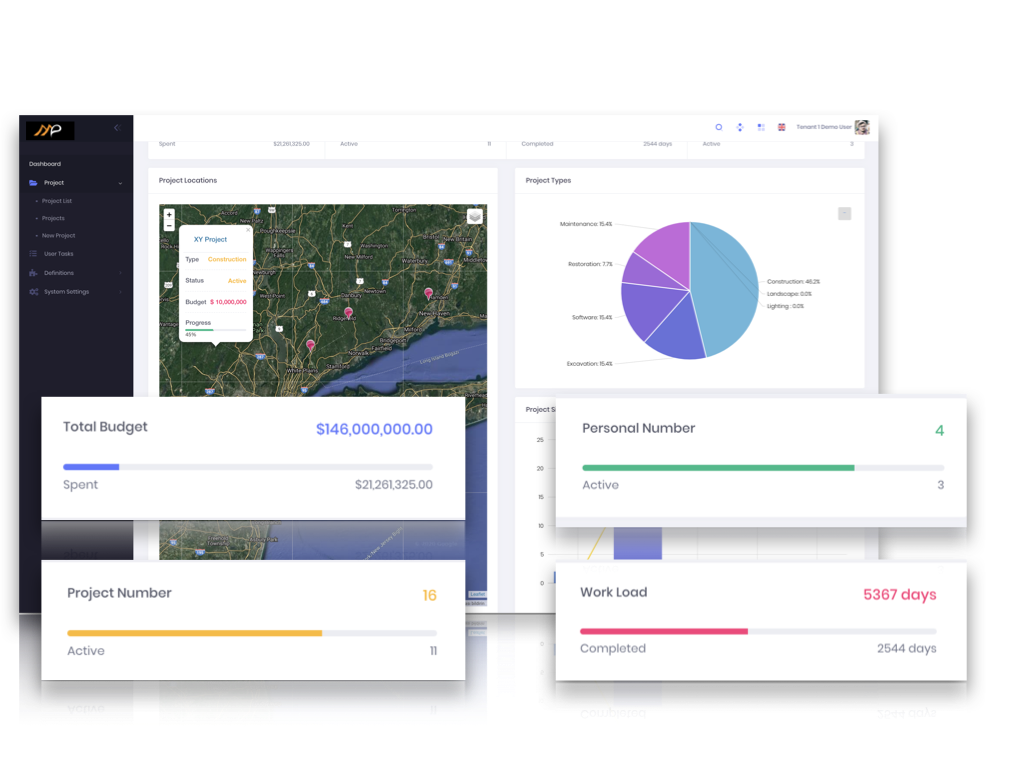
Dynamic, Geographic and Visual Dashboard
Start Free Trial
One Month Free
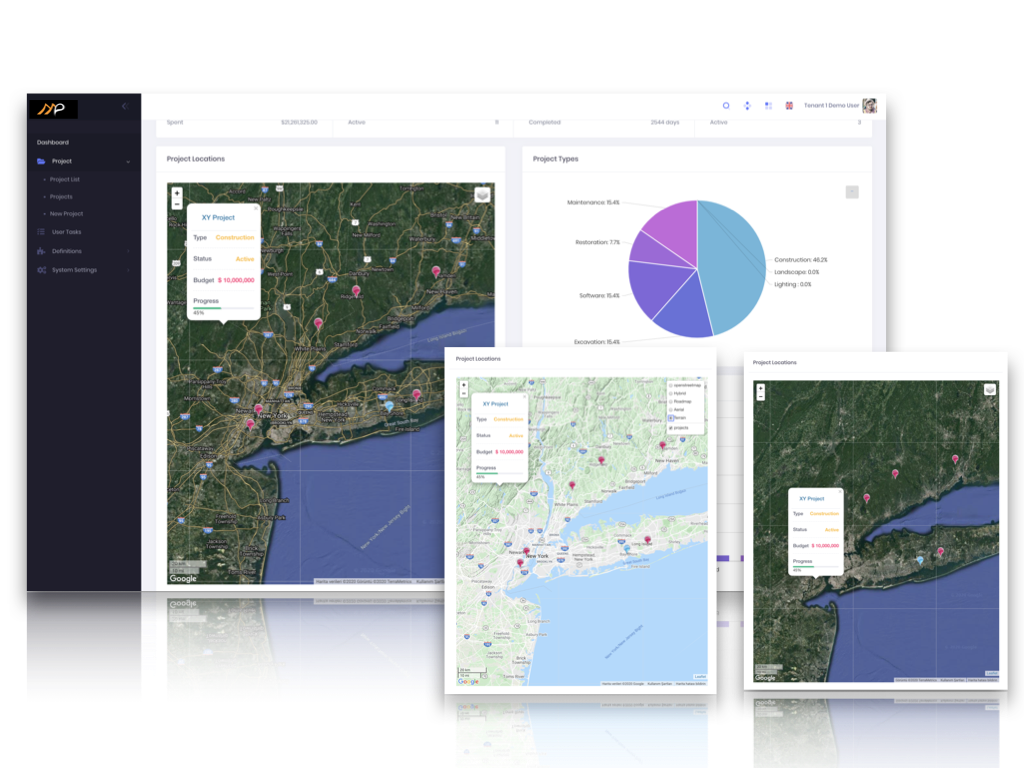
Dashboard Maps
You can monitor all your project details on map
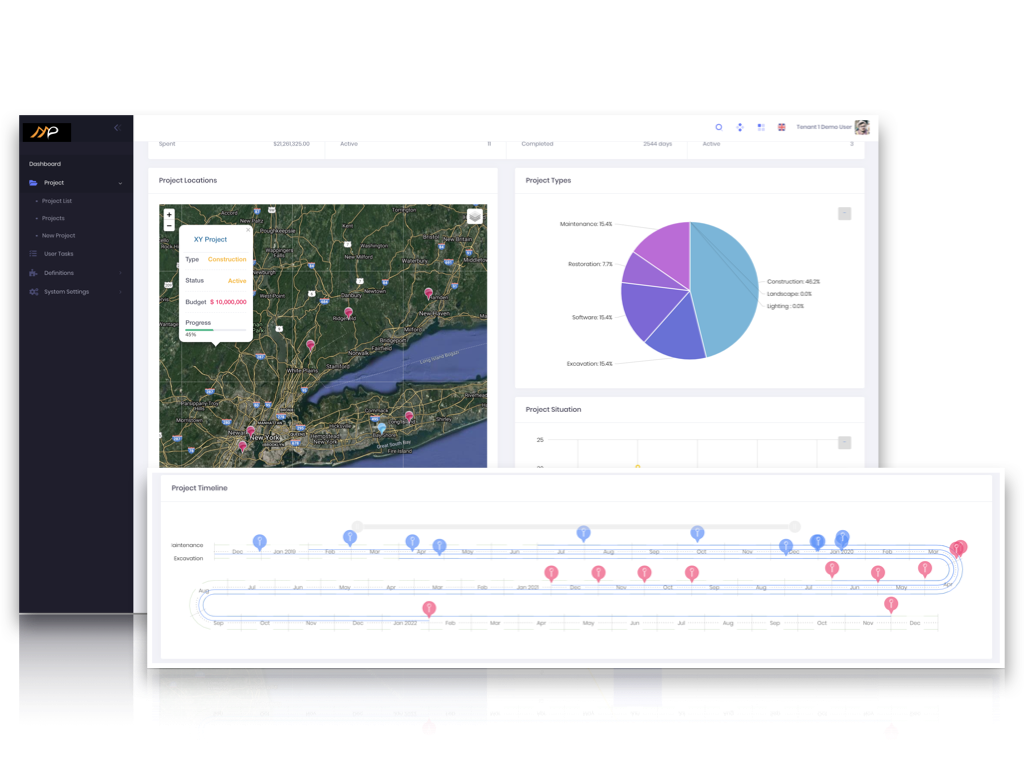
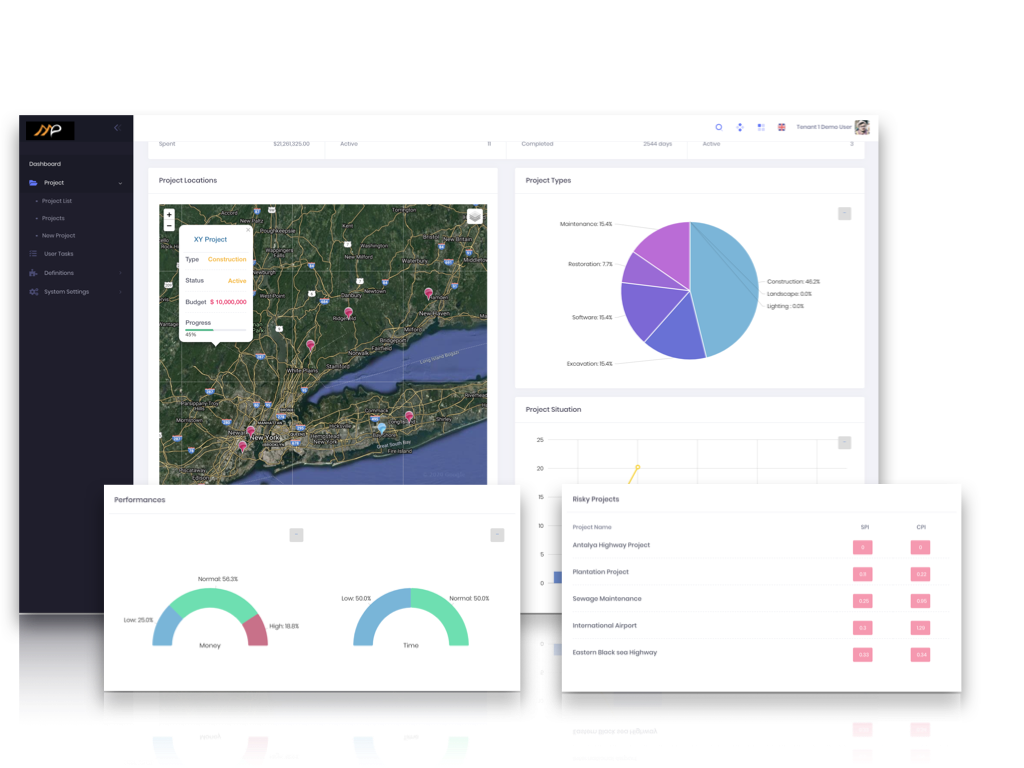
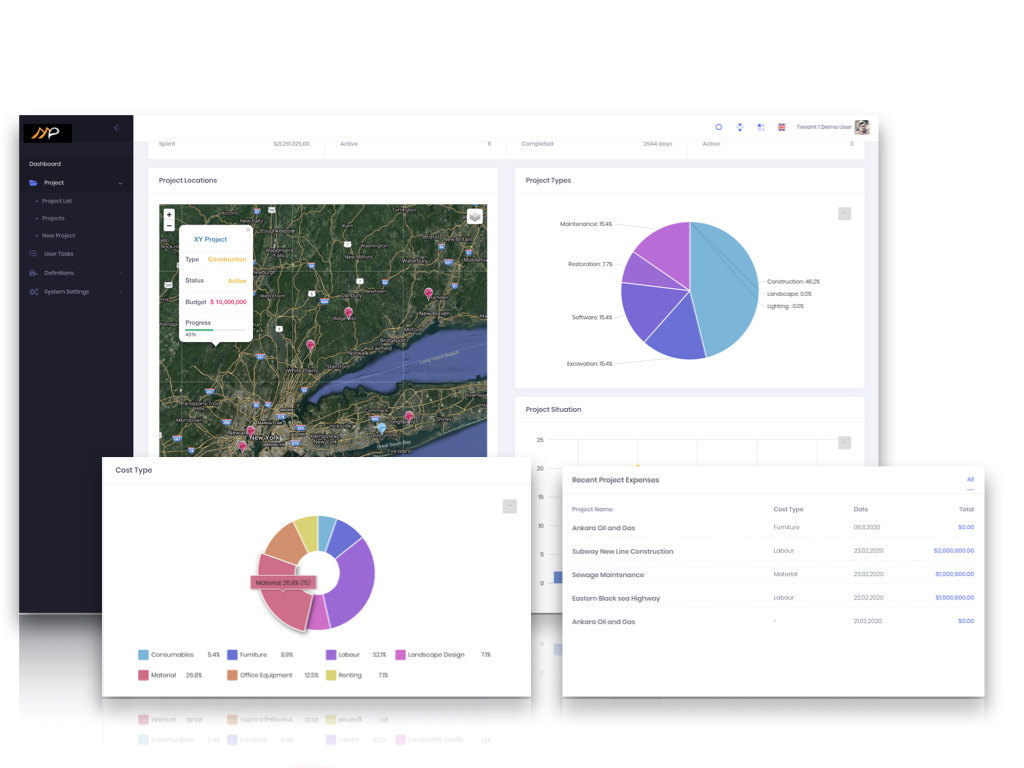
Dynamic and Visual
Visualize all your project data on a visual dashboard